
Life Expectancy and Healthy Life Expectancy; 2015-17
Description
This dataset is produced by Public Health England. Life expectancy data is calculated from deaths from all causes and mid-year population estimates, based on data aggregated over a three-year period. The indicator gives information on the estimated length of life and, along with data related to Healthy Life Expectancy, is an extremely important summary measures of mortality and morbidity. It is an estimate of the average number of years a newborn baby would survive if he or she experienced the age-specific mortality rates for that area and time period throughout his or her life. Figures reflect mortality among those living in an area in each time period, rather than what will be experienced throughout life among those born in the area. The figures are not therefore the number of years a baby born in the area could actually expect to live, both because the mortality rates of the area are likely to change in the future and because many of those born in the area will live elsewhere for at least some part of their lives.
Healthy life expectancy is a measure of the average number of years a person would expect to live in good health based on contemporary mortality rates and prevalence of self-reported good health. The prevalence of good health is derived from responses to a survey question on general health. For a particular area and time period, it is an estimate of the average number of years a newborn baby would live in good general health if he or she experienced the age-specific mortality rates and prevalence of good health for that area and time period throughout his or her life.
The data in this table is for the period 2015-2017 inclusive.
| Male | Male | Female | Female | |
| Life Expectancy | Healthy Life Expectancy | Life Expectancy | Healthy Life Expectancy | |
| Dudley | 78.9 | 59.6 | 82.9 | 60.9 |
| Sandwell | 77.1 | 57.1 | 81.3 | 59 |
| Walsall | 77.4 | 57.7 | 82.0 | 57.4 |
| Wolverhampton | 77.2 | 58.2 | 81.3 | 58.7 |
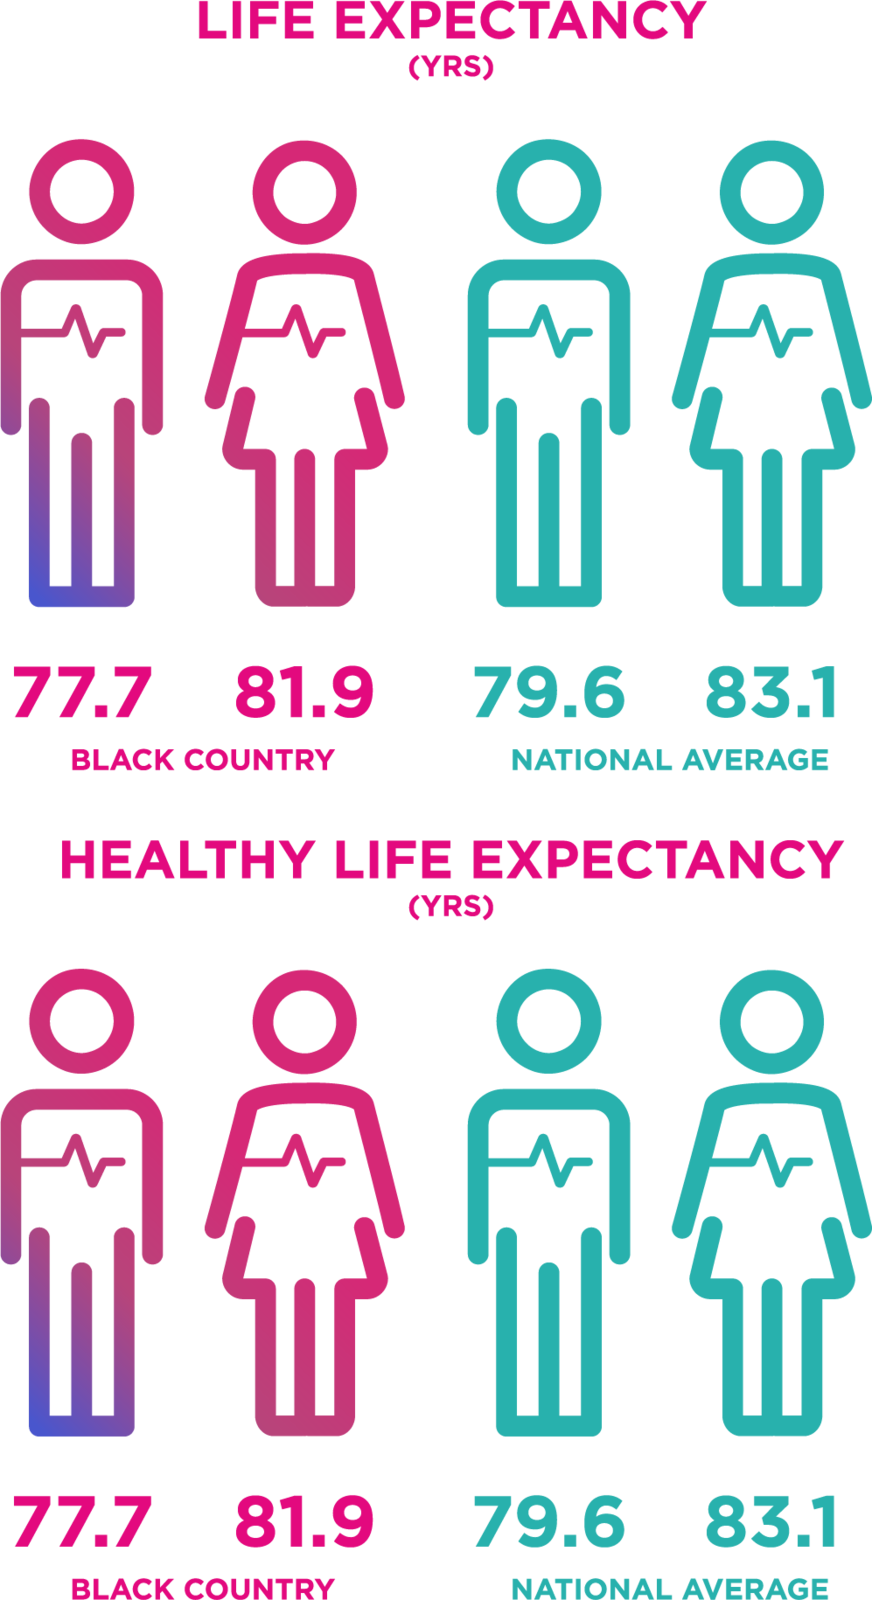
| Black Country | 77.7 | 58.2 | 81.9 | 59 |
| West Midlands | 78.8 | 62.1 | 82.7 | 62.9 |
| England | 79.6 | 63.4 | 83.1 | 63.8 |
Commentary
Life expectancy, for both men and women living in the Black Country, is lower than the national average. Life expectancy has actually fallen in the sub region over the last five years. From 2011-13 men could be expected to live to 77.9 whilst women could expect to live to 82.2. Conversely, the national average has slightly increased over this period.
Similarly, healthy life expectancy for Black Country residents is considerably lower than it is for people living elsewhere in England and the West Midlands.
View another health-wellbeing dataset
- 1 Adult Obesity; 2018-19
- 2 Child Obesity – Reception age and Year 6; 2018-19
- 3 Depression – Recorded Prevalence (18+); 2017-18
- 4 Estimated Prevalence of Diabetes (Diagnosed and Undiagnosed); 2019
- 5 Hip Fractures in People aged 65+; 2018-19
- 6 Life Expectancy and Healthy Life Expectancy; 2015-17
- 7 Anxiety - Self-Reported Wellbeing: People with a High Anxiety Score 2018-2019
- 8 Happiness - Self-Reported Wellbeing: People with a Low Happiness Score 2018-2019
- 9 Satisfaction - Self-Reported Wellbeing: People with a Low Life Satisfaction Score 2018-2019
- 10 Under 75 Mortality Rate – Cancer; 2017-19
- 11 Under 75 Mortality Rate – Cardiovascular Disease – 2017-19
Or explore our other datasets...