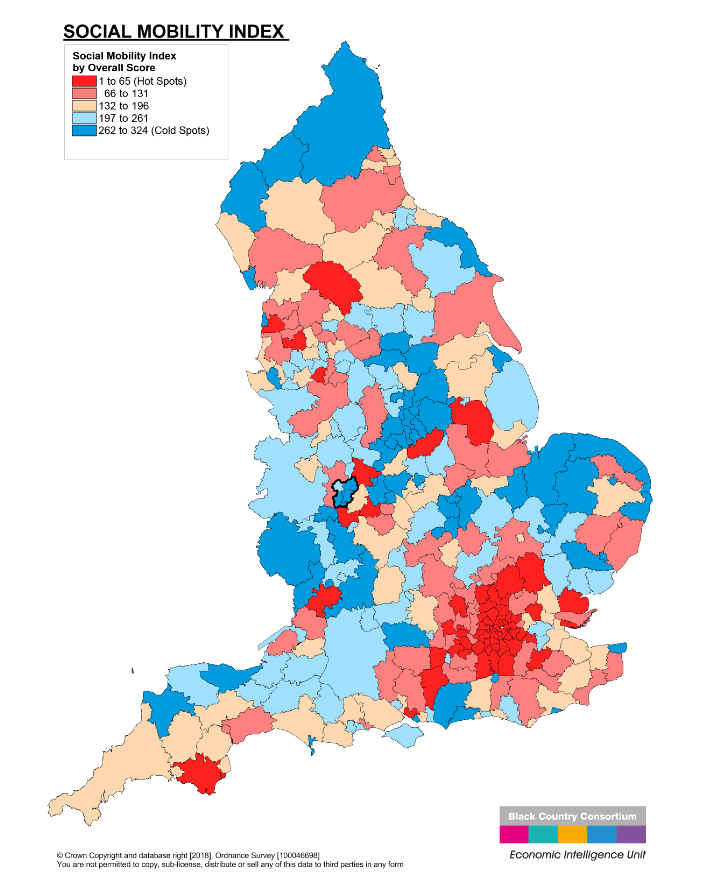
Social Mobility Index; 2017
Description
This dataset ranks local authorities on the prospects of disadvantaged young people growing up in their areas. The index uses a range of 16 indicators for every life stage, identifying the hot and cold spots of the country. The indicators are;
- % of nursery providers rated 'outstanding' or 'good' by Ofsted
- % of children eligible for FSM achieving a 'good level of development' at the end of Early Years Foundation Stage
- % of children eligible for FSM attending a primary school rated 'outstanding' or 'good' by Ofsted
- % of children eligible for FSM attending a secondary school rated 'outstanding' or 'good' by Ofsted
- % of children eligible for FSM achieving at least the expected level in reading, writing and maths at the end of Key Stage 2
- Average attainment 8 score for pupils eligible for FSM
- % of young people eligible for FSM that are not in education, employment or training (positive destination) after completing KS4
- Average points score per entry for young people eligible for FSM at age 15 taking A-level or equivalent qualifications
- % of young people eligible for FSM at age 15 achieving 2 or more A-levels or equivalent qualifications by the age of 19
- % of young people eligible for FSM at age 15 entering higher education by the age of 19
- % of young people eligible for FSM at age 15 entering higher education at a selective university (most selective third by UCAS tariff scores) by the age of 19
- Median weekly salary (£) of employees who live in the local area, all employees (FT and PT)
- Average house prices compared to median annual salary of employees who live in the local area
- % of people that live in the local area who are in managerial and professional occupations (SOC 1 & 2)
- % of jobs that are paid less than the applicable Living Wage Foundation living wage
- % of families with children who own their home
For each indicator, every local authority in the country is given a ranking (with 1 denoting the best performing area and 326 denoting the worst). The scores for each indicator are collated into four groupings; Early Years, Schools, Youth and Adulthood. An overall score is also provided.
Overall Score | Early Years | Schools | Youth | Adulthood | |
Dudley | 262 | 286 | 246 | 131 | 199 |
Sandwell | 269 | 314 | 169 | 97 | 289 |
Walsall | 276 | 235 | 295 | 121 | 266 |
Wolverhampton | 243 | 283 | 181 | 77 | 292 |
Commentary
This index demonstrates that Black Country residents have comparably low levels of social mobility. Only Wolverhampton has an overall score that places it outside of the bottom performing quartile of local authorities. More positively, all four Black Country authorities perform better on indicators relating to Youth with rankings falling within the top half of the country.
View another communities dataset
Or explore our other datasets...